Real-Time contribution

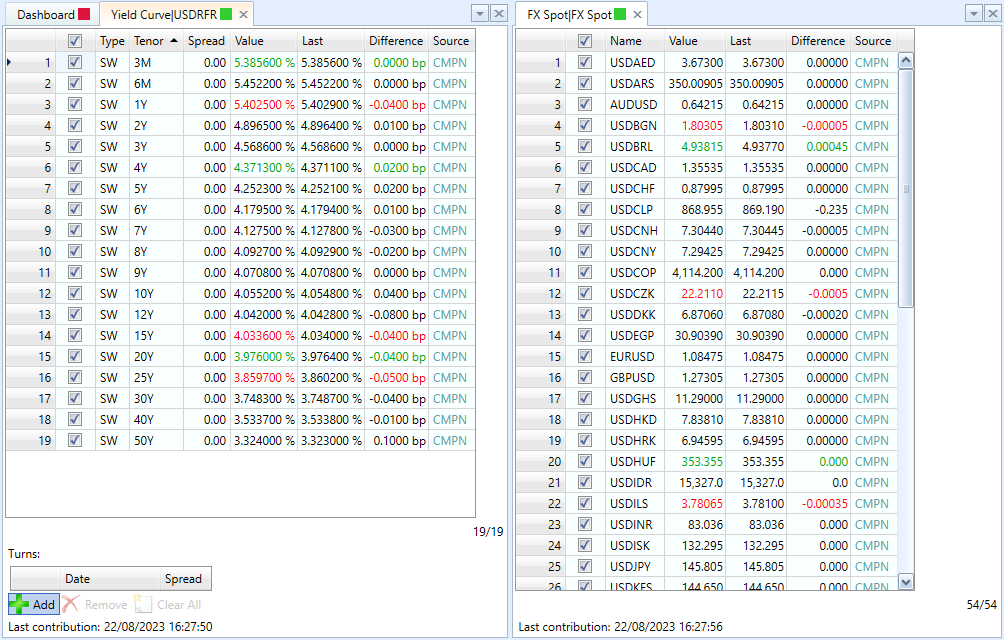
Data are contributed directly from Bloomberg (Terminal, B-PIPE, Data License), Refinitiv or TP ICAP feeds

Market data synchronisation and integrity checking before contribution

Automatic contribution with adjustable trigger threshold

Interoperability : thanks to a simple API (essentially one function that supports all types of market data),
it is very easy to adapt any existing contribution tool to make it feed CRZ Pricer database.
Built-in functions make it even straightforward in Excel.
Manual calibration

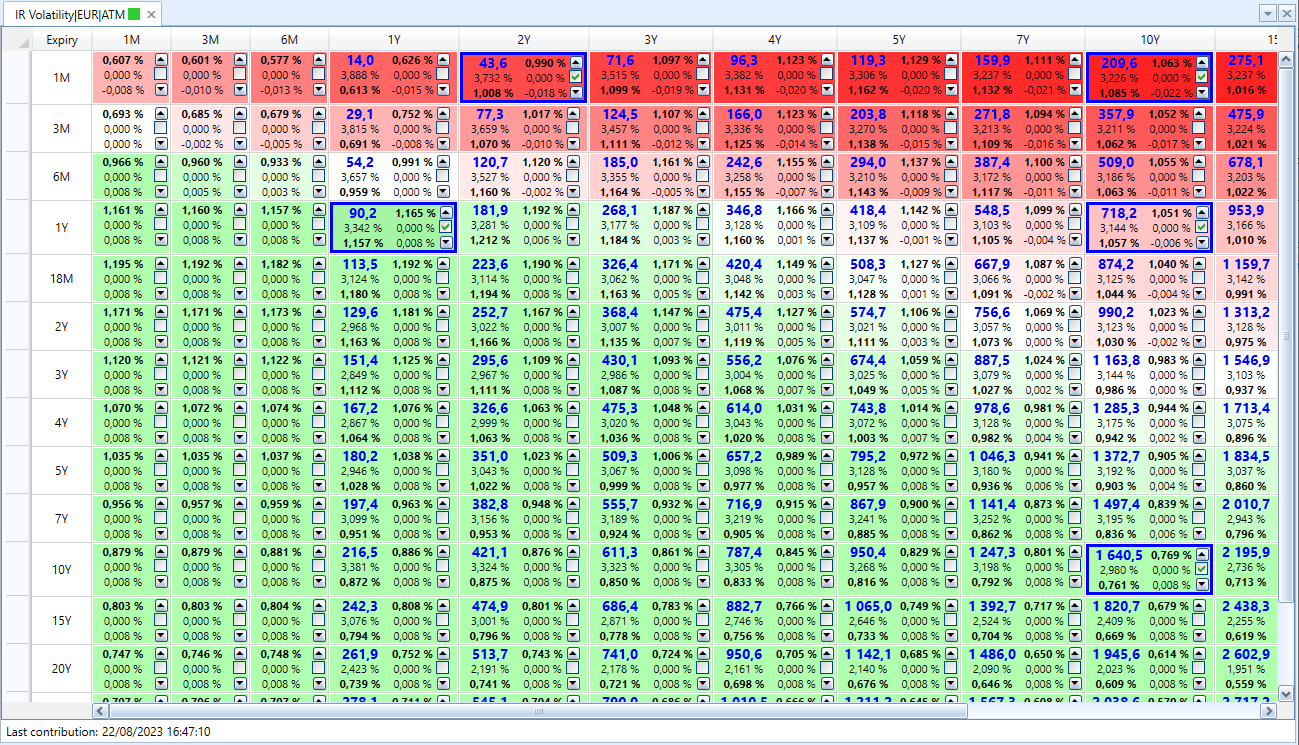
Specific algorithms combining interpolation, extrapolation, optimization and smoothing allow to calibrate less liquid market data (IR volatility, Asset Volatility, correlations)

Calibration based on historical data for non-observable data (inflation seasonality)
Stress scenarios

One can define stress scenarios by moving any market data
- 100+ predefined scenarios
- For cases not covered by predefined scenarios, generic scenario to move any market data point
- Scenarios (predefined or not) can be combined. E.g., Yield Curve EUR6M +50bp and EURUSD +5%
- All CRZ Pricer features will apply to the derived market thus defined

Change of risk representation, e.g. EUROIS can be changed from outright to spread curve

Pricing at a future date is possible
More generally, pricing date can be different from market data. Various hypotheses on how the market has moved between these dates are possible
Flexible market data analysis views

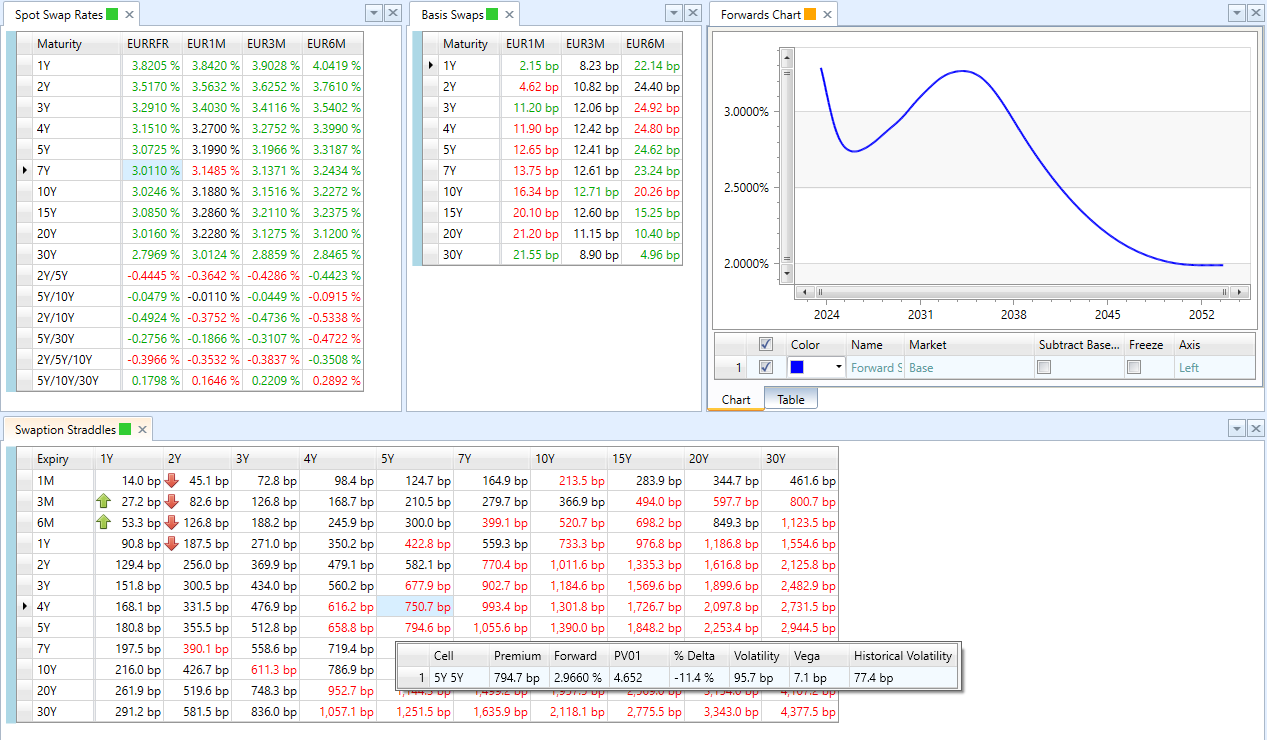
70+ market data screens allow to efficiently follow the market :
- Spot rates grids (swaps, amortized swaps, FX, ...)
- Forward rate grids (swaps, year-on-year inflation, livret A, ...)
- Option pricing grids (caps & floors, swaptions, CMS swaps, CMS spread options, ...)
- Charts (skew, forward rates, historical data, 3D surface)
- Relative value indicators

These screens support real-time update
They are fully configurable with many additional features : automatic generation of the deal corresponding to a given value in the grid, composite pages,
comparison of 2 markets (including scenarios)

We can easily add new market data analysis views to fit your requirements


